

.png)
.avif)
CONTENT
Event day rarely tells the full story. The registration rush may have been smooth, sessions packed, and sponsors satisfied. But once the venue clears, the real question begins: did the event actually achieve what it set out to do? Without a structured way to analyze attendance patterns, engagement levels, lead quality, and operational performance, even a well-run event can leave you guessing. You won’t be sure about what truly worked, and what should change next time.
That’s why post-event reporting has become a critical step for event teams looking to scale performance. The data collected after the event often determines how much better the next one can be.
In this article, we’ll explore what post-event reporting is, why it matters for improving event performance, and how to create a comprehensive report. You’ll also see practical event reporting examples to simplify the process.
At a Glance
- A post-event report turns event data (attendance, engagement, ROI, logistics) into actionable insights, enabling you to measure success and improve future events.
- It helps event leaders like you objectively evaluate KPIs, identify operational bottlenecks, demonstrate sponsor value, and build a reliable performance benchmark for future events.
- The steps to create one include consolidating event data and structuring the report to analyze attendance, logistics, engagement, marketing performance, and financial ROI.
- A proper event reporting example ends with key takeaways and a future roadmap based on the insights gained.
Post-Event Report: Definition and Why It’s Critical for Event Performance
A post-event report is a structured analysis of how your event actually performed once it concluded. Instead of relying on anecdotal feedback or surface-level impressions, the report consolidates measurable data across the entire event lifecycle.
In practice, a post-event report serves as both an evaluation tool and a strategic planning resource. For event owners like you running conferences, trade shows, or corporate summits, this report becomes the central reference point.
Why Post-Event Reporting Matters
A well-structured post-event report provides more than just a recap. It delivers actionable insights that shape future event strategy.
- Objectively measure event success: By comparing planned KPIs with actual results, such as attendance numbers, engagement rates, and budget performance, you can clearly determine whether the event met its objectives.
- Identify operational improvements: Every event reveals operational lessons. Post-event reporting helps pinpoint issues such as registration bottlenecks, communication gaps, or technology challenges.
- Inform smarter planning for future events: Insights into attendee behavior, session popularity, and engagement patterns help shape future programming, marketing strategies, and venue planning. Over time, these insights compound into a stronger and more predictable event strategy.
- Track event ROI and strategic value: Sponsors and leadership often want clear proof of an event’s impact. Post-event reports provide measurable indicators such as leads generated, revenue performance, brand exposure, and attendee satisfaction, helping demonstrate the event’s value.
- Align internal teams: Sharing post-event insights across marketing, sales, operations, and leadership teams ensures everyone understands the event’s outcomes. This alignment helps teams replicate successful tactics and improve future coordination.
- Create a historical performance record: Over time, post-event reports build a valuable data archive. Comparing results year-over-year allows you to track growth, measure improvements, and maintain consistency in event quality.

Step-by-Step Framework for Creating a Successful Post-Event Report
A strong post-event report goes beyond listing statistics. It connects operational data, financial outcomes, attendee behavior, and stakeholder feedback into a clear narrative about how the event performed. For event leaders running conferences, trade shows, and corporate events, the goal is simple: turn event data into actionable decisions for the next event cycle.
Below is a practical framework used by many high-performing event teams.
1. Gather and Consolidate All Event Data
The foundation of any post-event report is reliable data. Before preparing the report, collect information from every system used during the event. That includes registration platforms, badge scanning tools, marketing analytics, exhibitor reports, and more.
Example: Data Consolidation Workflow
Using fielddrive’s on-site solutions, you can track attendance and attendee activity in real time, ensuring accurate data for your post-event report.

2. Define the Report’s Structure
A well-organized report ensures your insights are easy to follow and digest. Defining a clear structure from the start will keep your report concise, professional, and impactful. Here’s how to do that:
- Identify the report’s purpose: Determine whether it’s for internal team analysis, stakeholders, sponsors, or all of the above. This will shape how detailed the sections need to be.
- Decide on key sections: Outline the main sections, such as an executive summary, financial analysis, and attendee feedback. Keep these consistent across all event reports to make comparisons easier.
- Use a logical flow: Begin the report with high-level insights (such as an executive summary) and gradually move into specific details (such as analytics and financials).
- Choose the format: Decide between a narrative format, bullet points, or a combination of both. Keep the format consistent and consider adding visuals, such as graphs, to simplify complex data.
- Tailor the length: Ensure the report is concise and focused. For senior management or sponsors, focus more on high-impact metrics and summaries, while internal reports can include more granular details.
3. Write a Clear Executive Summary
Your executive summary acts as the snapshot of the entire post-event report. Stakeholders often read this section first to understand the event’s overall performance.
A strong event summary typically includes:
- Event name, date, and location
- Event objectives and target audience
- Key highlights and outcomes
- Major challenges encountered
- High-level recommendations for improvement
Key Executive Summary Elements (Sample)
Limit the summary to one or two paragraphs, making sure it covers all key points without going into too much detail.
Why it matters: Executives and sponsors rarely have time to read the entire report. A concise executive summary ensures they immediately understand impact, outcomes, and next steps.
3. Analyze Attendance and Registration Trends
Attendance data reveals how effectively your marketing and registration strategies performed. Your post-event report should examine not only total attendance but also patterns within the data.
Metrics to include:
- Total registrations vs. actual attendance
- No-show rate
- Registration type breakdown (VIP, exhibitor, attendee, media)
- Geographic and demographic trends
Key insight: A high registration count does not always equal success. Strong attendance conversion is a better indicator of event demand and marketing accuracy.

4. Evaluate Event Logistics and Operations
Operational feedback reveals how smoothly the event ran from a participant’s perspective. Your event report should analyze logistical performance across several areas.
Areas to evaluate:
- Registration and check-in experience: Analyze the efficiency of the check-in process by reviewing wait times, attendee satisfaction, and any technical issues with badge printing or check-in kiosks.
- Venue layout and crowd flow: Evaluate how well the venue accommodated your event needs, considering factors such as space, layout, and accessibility.
- Technology reliability: Review the performance of audio-visual systems and other technology used during the event, checking for any glitches or disruptions.
- Transportation and accessibility: Examine the convenience and availability of transportation options for attendees, including parking, shuttle services, and public transport.
- Staffing and onsite coordination: Evaluate how effectively staff and volunteers were managed and whether the team handled onsite tasks efficiently.
- Catering and refreshments: Assess how well catering services met attendees' expectations regarding food quality, availability, and overall service experience.
5. Review Sponsor and Exhibitor Performance and Feedback
For conferences and trade shows, sponsor and exhibitor results are one of the most critical sections of the post-event report. Sponsors want measurable outcomes such as brand exposure, lead generation, booth traffic, and networking opportunities.
Sample exhibitor insights:
- Average leads per exhibitor: 210 leads
- Top-performing booth traffic: AI software company with 1,100 scans
- Lead qualification rate: 45% high-value prospects
Pro tip: Provide sponsors with clear data to strengthen relationships and make it easier to secure renewals and sponsorships for the next event.
Furthermore, including their collected feedback is crucial. These insights can provide valuable perspectives on what worked well and what could be improved in future events. Adding them briefly to your report also shows that you’re taking their insights seriously to drive positive change.
6. Provide a Detailed Budget Breakdown
Financial transparency is essential for leadership and stakeholders evaluating the event. While reporting an event, you should include a clear comparison between projected and actual financial performance.
Typical budget categories:
- Revenue sources: Ticket sales, sponsorships, exhibitor fees, merchandise, or add-ons
- Expense categories: Venue rental, technology and production, marketing and promotion, staffing and logistics
Examples:
- "The actual spend on marketing was $5,000, 20% lower than the projected $6,250 due to better-than-expected organic reach."
- "Sponsorship revenue exceeded expectations, contributing $50,000 compared to the initial $40,000 goal."
- "Logistics costs were higher than anticipated due to last-minute shipping charges, adding an extra $2,000 to the budget."
- "With a total revenue of $200,000 and total costs of $150,000, the event achieved a 33% ROI."
7. Measure Engagement and Interaction
Engagement metrics help evaluate whether attendees actively participated in the event. Track and include aspects such as session attendance rates, event app activity, networking participation, social media engagement, and gamification participation.
Examples of engagement indicators:
- Average session attendance: 68% capacity
- Networking meeting requests: 1,200 scheduled
- Event hashtag reach: 2.4 million impressions
Also Read: Top Post-Event Engagement Strategies to Boost Interaction
8. Evaluate Marketing and Promotion Performance
Marketing performance explains how effectively your event attracted its audience. Your post-event report should analyze each promotional channel to identify which strategies generated the most registrations.
Marketing channels to evaluate include email marketing campaigns, social media promotions, paid advertising, influencer or partner promotions, and event website traffic.
Examples:
- "Email campaigns contributed to 40% of total registrations, outperforming social media ads, which stood at 25%."
- "The live Q&A session on Instagram saw 300 participants, generating significant attendee interaction and brand visibility."
- "Google Ads generated 200 registrations at a cost-per-acquisition of $10, staying within the allocated budget."
- "The pre-event blog posts drove 5,000 visitors to the event landing page, contributing to 10% of overall ticket sales."
9. Identify Key Takeaways and Lessons Learned
This section of the report focuses on the most valuable insights from the event. Here are the key questions to answer:
- What operational strategies worked well?
- Which sessions or topics attracted the most interest?
- What challenges affected the attendee experience?
- What changes should be implemented next time?
Sample takeaways:
- High demand for interactive workshops indicates interest in practical learning formats.
- Peak registration traffic occurred within the final two weeks before the event.
- Exhibitors requested more networking opportunities with attendees.
10. Outline Future Event Improvements and Plans
The final section of the post-event report should translate insights into clear action items for the next event.
Sample future planning recommendations:
Pro tip: Indicate which insights should be addressed immediately and which can be considered for long-term improvements.
11. Add Appendices to Support Your Findings
The final step in building a strong post-event report format is to add an appendix. This is where you include supporting materials that validate your analysis without cluttering the main report. For stakeholders who want deeper context, the appendix acts as a reference library of evidence behind your insights.
Typical appendix materials include:
- Sponsor and partner list: Include logos, company names, and their role in the event.
- Event agenda and program: Provide the full schedule, session descriptions, and speaker details.
- Event photos and videos: Visual highlights of sessions, networking moments, and sponsor activations.
- Media coverage and press mentions: Link to press releases, news articles, and industry coverage generated by the event.
- Testimonials or short interviews: Quotes from attendees, speakers, exhibitors, or partners that reflect the event experience.
- Post-event survey results: Summarize attendee satisfaction scores, feedback, and key comments.
Note: While this process covers a wide range of key elements, make sure to include only those that apply to your event. Tailor the report to focus on the most relevant data and insights for your specific needs and objectives.
Also Read: 57+ Post Event Evaluation Questions Attendees Actually Answer
Post-Event Reporting Examples: A Sample Report for a Conference
To see how the framework works in practice, here’s a realistic post-event report example based on a mid-to-large industry conference. This example reflects the type of metrics and operational insights event directors, organizers, and sponsors typically expect when reviewing an event’s performance.
Event Overview
- Event Name: Global FinTech Innovation Summit 2026
- Date: 12–13 January 2026
- Location: ExCeL London, United Kingdom
- Event Type: FinTech conference and exhibition
- Target Audience: Financial technology companies, banking leaders, investors, and regulators
- Objectives:
- Facilitate networking between fintech startups and enterprise financial institutions
- Generate qualified leads for exhibitors and sponsors
- Position the summit as a leading fintech knowledge platform
Executive Summary
The Global FinTech Innovation Summit 2026 attracted more than 3,200 attendees across two days, exceeding attendance projections by 10%. The event delivered strong engagement across keynote sessions, panel discussions, and networking areas.
Operationally, registration flow improved significantly compared to the previous year. With touchless check-in kiosks and live badge printing, attendees could check in within seconds. Exhibitors also reported strong lead generation results, with more than 18,000 leads captured across the exhibition floor. However, several keynote sessions reached full capacity, suggesting the need for larger rooms or overflow areas at future editions.
Attendance and Registration Analysis
Attendance data revealed valuable insights about audience behaviour and marketing performance.
Registration Breakdown
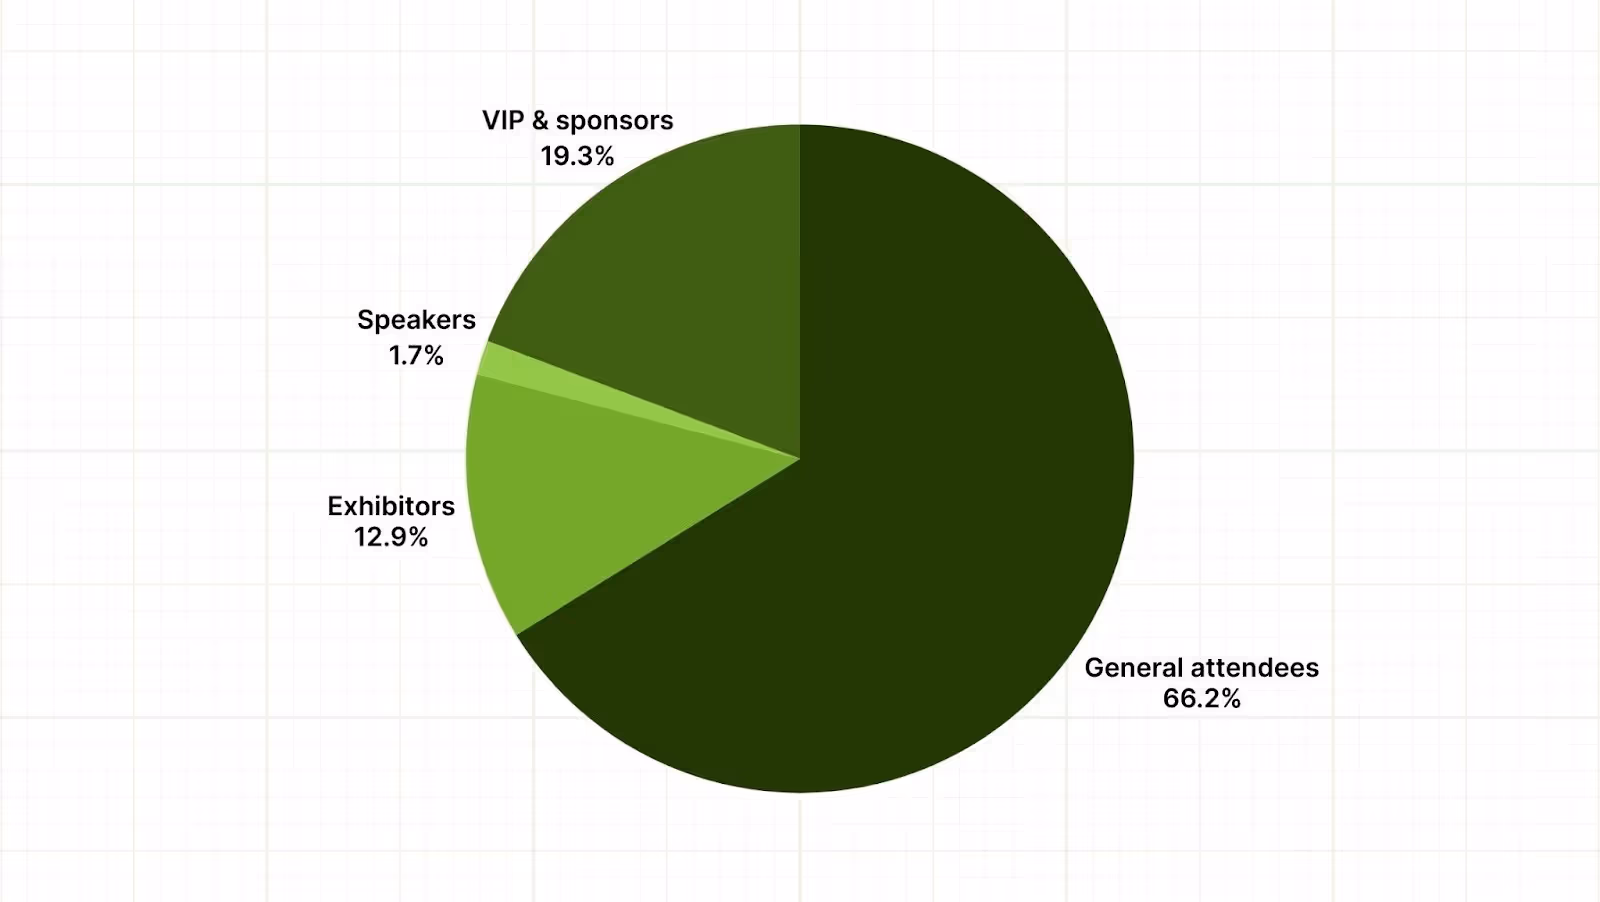
Geographic Distribution
- United Kingdom: 52%
- United States: 30%
- Europe: 13%
- Other regions: 5%
Nearly 28% of registrations occurred in the final two weeks before the event, highlighting the importance of maintaining strong marketing activity close to the event date. Hence, for future events, we plan to maintain strong marketing visibility in the final weeks leading up to the event date.
Operational Performance Review
From an operational perspective, the event ran smoothly across most touchpoints.
The biggest improvement occurred at registration. In previous years, attendees often experienced queues of 15–20 minutes during peak arrival periods. By introducing self-service check-in kiosks and live badge printing, the average processing time per attendee dropped to under 10 seconds.
Venue logistics also worked well overall. The exhibition floor layout allowed smooth movement between booths, and networking areas remained consistently active throughout both days.
However, session capacity became an issue for several keynote presentations. Popular sessions reached standing-room-only levels, disrupting the flow in nearby areas.
For future events, we are considering:
- Increasing keynote room capacity
- Introducing overflow viewing areas
- Staggering session start times to reduce congestion
Sponsor and Exhibitor Performance
Across the exhibition floor, companies captured an average of about 215 leads per exhibitor, with some high-traffic booths recording nearly 1,000 badge scans.
Sponsors also benefited from strong brand visibility. The event generated extensive exposure through keynote sponsorships, branded networking sessions, and event marketing campaigns.
Feedback collected from exhibitors highlighted three areas they valued most:
- High-quality attendee conversations
- Strong foot traffic across the exhibition floor
- Structured networking sessions that facilitated introductions
Several exhibitors suggested adding more dedicated networking blocks to future events to increase lead-generation opportunities.
Budget and ROI Summary
Financially, the event delivered a positive return. Total revenue reached approximately £820,000, generated primarily through ticket sales, sponsorship packages, and exhibitor booth fees.
Revenue Sources
- Ticket sales: £420,000
- Sponsorship packages: £260,000
- Exhibition booth fees: £140,000
Total operational costs amounted to around £590,000, resulting in a net profit of roughly £230,000 and an estimated ROI of nearly 39%.
Sponsorship demand played a major role in this performance. Premium sponsor packages sold out earlier than expected, highlighting strong industry interest in the event.
Engagement and Marketing Insights
Engagement metrics showed that attendees actively participated throughout the event.
Workshops and interactive sessions recorded the highest attendance rates, while traditional lecture-style talks saw slightly lower participation. This suggests that future event programming should prioritize hands-on learning formats and discussions.
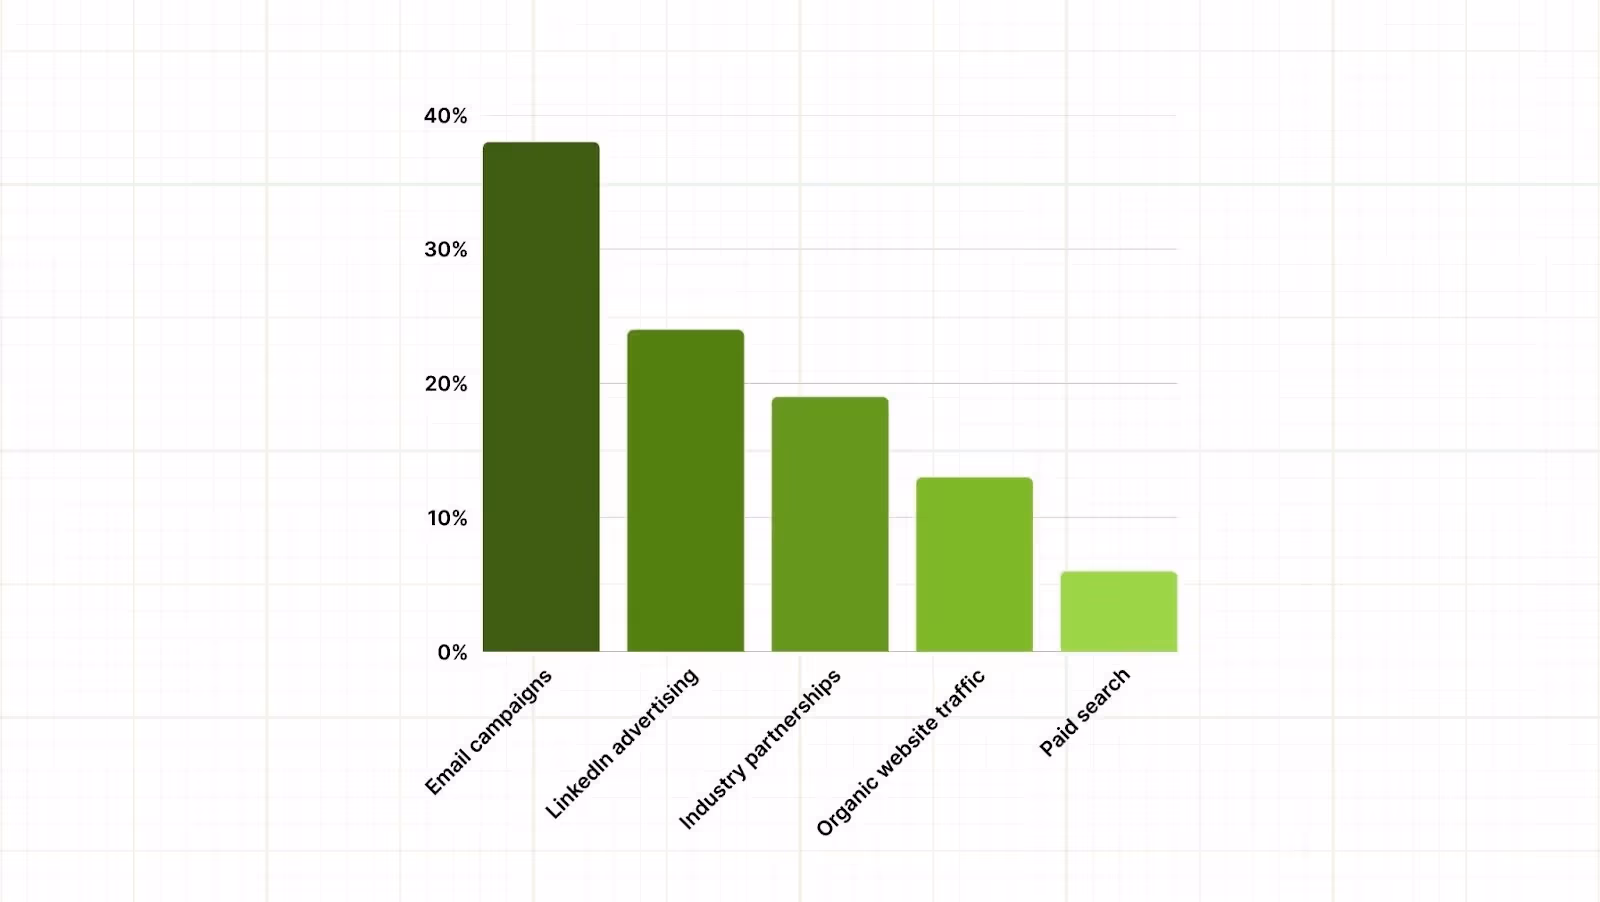
Marketing analytics also revealed which promotional channels performed best. Email campaigns generated the largest share of registrations (38%), while industry partnership promotions delivered some of the highest-quality attendees.
Social media also played a significant role in increasing visibility, with the event hashtag reaching nearly 2 million impressions across LinkedIn and X.
Channel-wise analytics:
Key Takeaways
Several insights emerged from this post-event report:
- Interactive sessions attracted higher engagement than traditional presentations.
- Late registration trends confirm the importance of final-week promotional campaigns.
- Fast, touchless check-in significantly improved the attendee arrival experience.
- Exhibitors benefited most from structured networking opportunities.
Future Improvements and Recommendations
Based on the event’s outcomes, we identified several improvements for the next edition:
- Increase capacity for keynote sessions to accommodate demand.
- Introduce additional networking lounges to encourage attendee interaction.
- Expand the exhibition floor to accommodate growing interest from sponsors.
- Continue using touchless check-in and live badge printing to maintain fast entry.
Wrapping Up
A well-prepared post-event report transforms your event from a one-time experience into a continuous improvement engine. More importantly, structured reporting ensures that every event generates actionable insights that strengthen future planning, improve attendee experiences, and demonstrate measurable value to stakeholders.
This is where the right onsite technology and data infrastructure make a real difference. With solutions like touchless check-in kiosks, live badge printing, session scanning, and the fielddrive Leads app, fielddrive helps you capture accurate event data. Combined with real-time dashboards and post-event analytics, these insights make it far easier to compile post-event reports that reflect operational performance and business impact. Speak with our experts to explore further.

FAQs
1. How detailed should an event analytics report template be?
An event analytics report template should capture both high-level outcomes and granular operational metrics. That includes attendee flow patterns, session popularity, lead generation performance, engagement indicators, and marketing conversions. The goal is to identify operational bottlenecks and optimization opportunities.
2. What’s the difference between reporting on an event and evaluating event success?
Reporting on an event focuses on documenting performance metrics and outcomes, while evaluation interprets that data to determine strategic impact. Reporting collects the evidence; evaluation explains what those numbers mean and how they should influence future event planning decisions.
3. What common mistakes can we avoid when reporting an event?
When reporting an event, organizers often place too much emphasis on vanity metrics such as total registrations. A stronger approach is to include operational insights such as attendee flow efficiency, session attendance patterns, lead qualification rates, and engagement trends to reveal deeper insights into event performance.
4. How long should a professional event report typically be?
The length of an event report depends on the event scale. Small corporate events may require 5–8 pages, while large conferences or exhibitions often produce reports exceeding 20 pages because they include detailed analytics, sponsor performance, and operational insights.
.svg)
.svg)
.svg)
Want to learn how fielddrive can help you elevate your events?
Book a call with our experts today

.svg)